Sales reports a good quarter. The pipeline is full, the most important quotes are out, several deals are “about to close”. A few weeks later, orders are missing. The planned hires, reserved project capacity and investments are still on the table. An unreliable forecast affects the entire company. One question is therefore decisive: Can management actually make decisions based on the CRM forecast?
To do so, a forecast has to do more than multiply opportunity values by probabilities. It has to show which deals are reliable, where risks are emerging and how much time is left to take countermeasures.
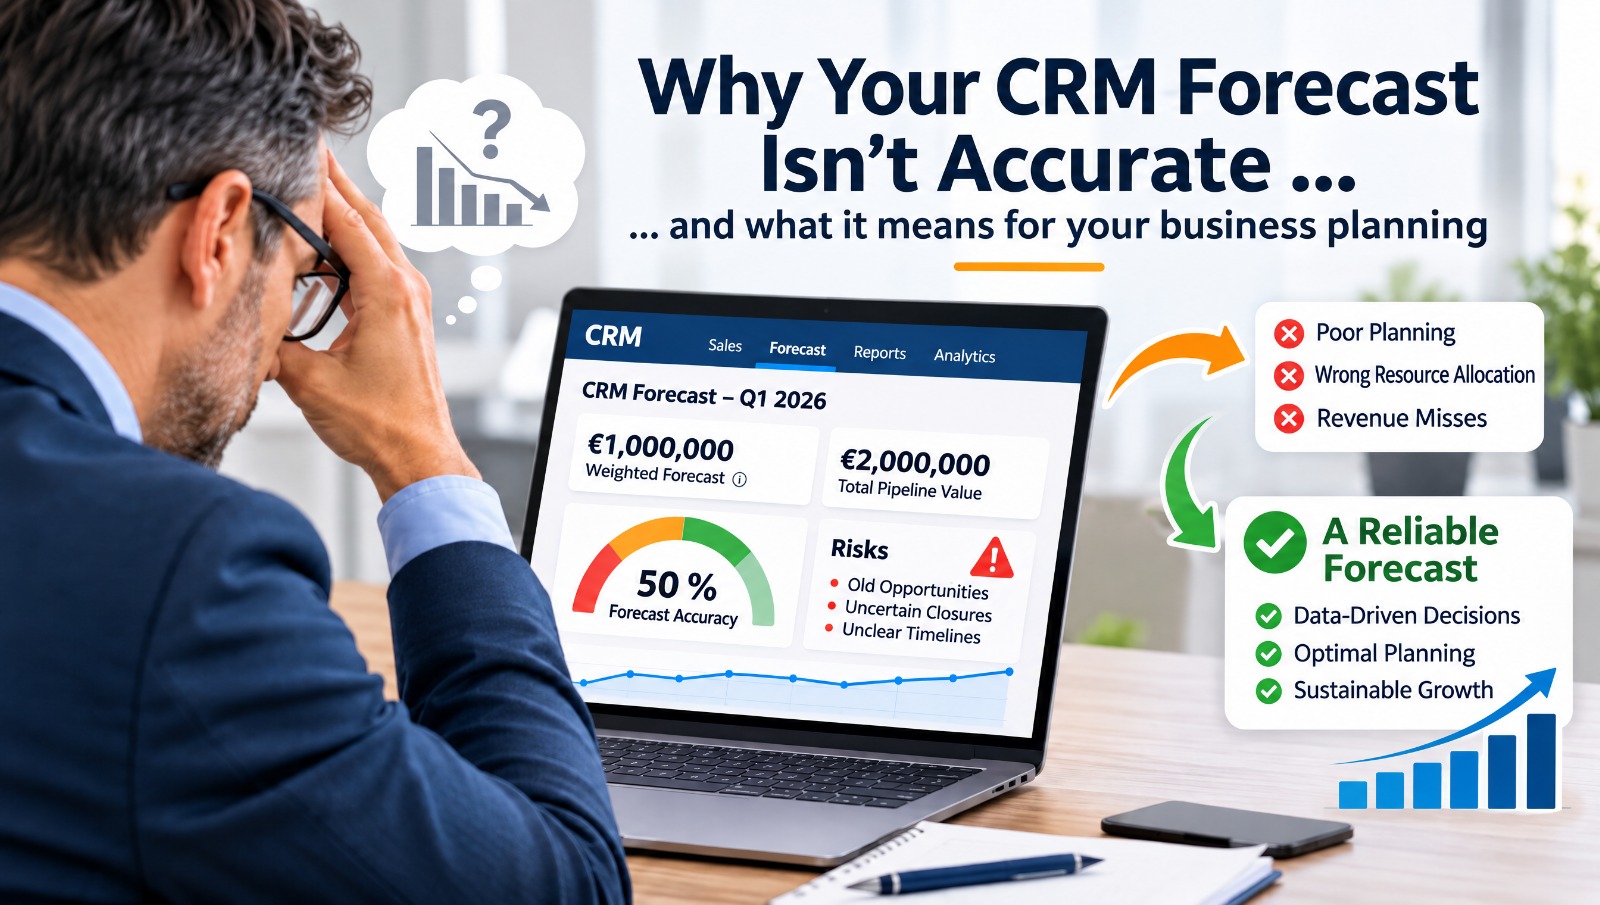
Table of contents
- A wrong forecast has consequences beyond sales
- Why a full pipeline is not yet a reliable forecast
- Five causes of poor forecasts
- How accurate does a forecast really need to be?
- Clear sales stages instead of gut feeling
- The metrics management needs
- Forecasting is a leadership process
- Ten concrete improvements in the CRM
- Where AI helps with forecasting
- Practical example: from wishful pipeline to reliable planning
- Checklist: Does your CRM forecast support company planning?
- Conclusion: A forecast has to support decisions
A wrong forecast has consequences beyond sales
Anyone who relies on uncertain deals may hire too early or reserve capacity that is then missing when other customers order. Anyone who systematically plans too cautiously, on the other hand, risks supply bottlenecks or misses growth opportunities. Both cost money.
There is also a frequently overlooked distinction: order intake, revenue and cash receipts are different figures. A signed project contract can be booked as an order today, generate revenue over several months and only lead to payments after agreed milestones. For subscriptions, total contract value, annual recurring value and periodic revenue also have to be kept apart.
Before a CRM forecast feeds into company planning, sales and finance therefore have to clarify exactly what is being forecast. Liquidity planning additionally requires payment terms, invoice dates and expected cash receipts. A CRM close date alone is not enough for that.
Why a full pipeline is not yet a reliable forecast
Suppose your pipeline contains two million euros for the coming quarter. With an average assigned probability of 50 percent, this results in a weighted value of one million euros. That looks clear. How reliable this million is, however, depends on how the probabilities came about and whether the deals are actually realistic in this quarter.
With many small, comparable deals, historically validated probabilities can provide a sensible basis. With a few large projects, on the other hand, the average quickly conceals considerable risk. A single order worth 600,000 euros usually comes in full, later or not at all. Weighting it at 50 percent does not turn it into a plannable order worth 300,000 euros.
The time perspective matters too. An opportunity that might be won at some point does not necessarily belong in the forecast for the current month. Probability and timing of a deal must be assessed together.
Statistics: Trust in data cannot be taken for granted
In Salesforce’s “State of Sales” report, 6th edition from 2024, only 35 percent of the sales professionals surveyed said they fully trust the accuracy of their company’s data. The study is based on 5,500 respondents from 27 countries. This is a cross-industry survey finding, not a measurement of forecast accuracy and not a study specific to the German Mittelstand.
| Metric | Value | Context |
|---|---|---|
| Complete trust in the accuracy of company data | 35% | Self-reported by the sales professionals surveyed |
| Study participants | 5,500 | Sales professionals from 27 countries; survey conducted March to April 2024 |
Source: Salesforce, State of Sales, 6th edition – results report from July 25, 2024. For company management, this leads to a practical task: check the quality of the information behind the forecast before building further calculations on it.
Five causes of poor forecasts
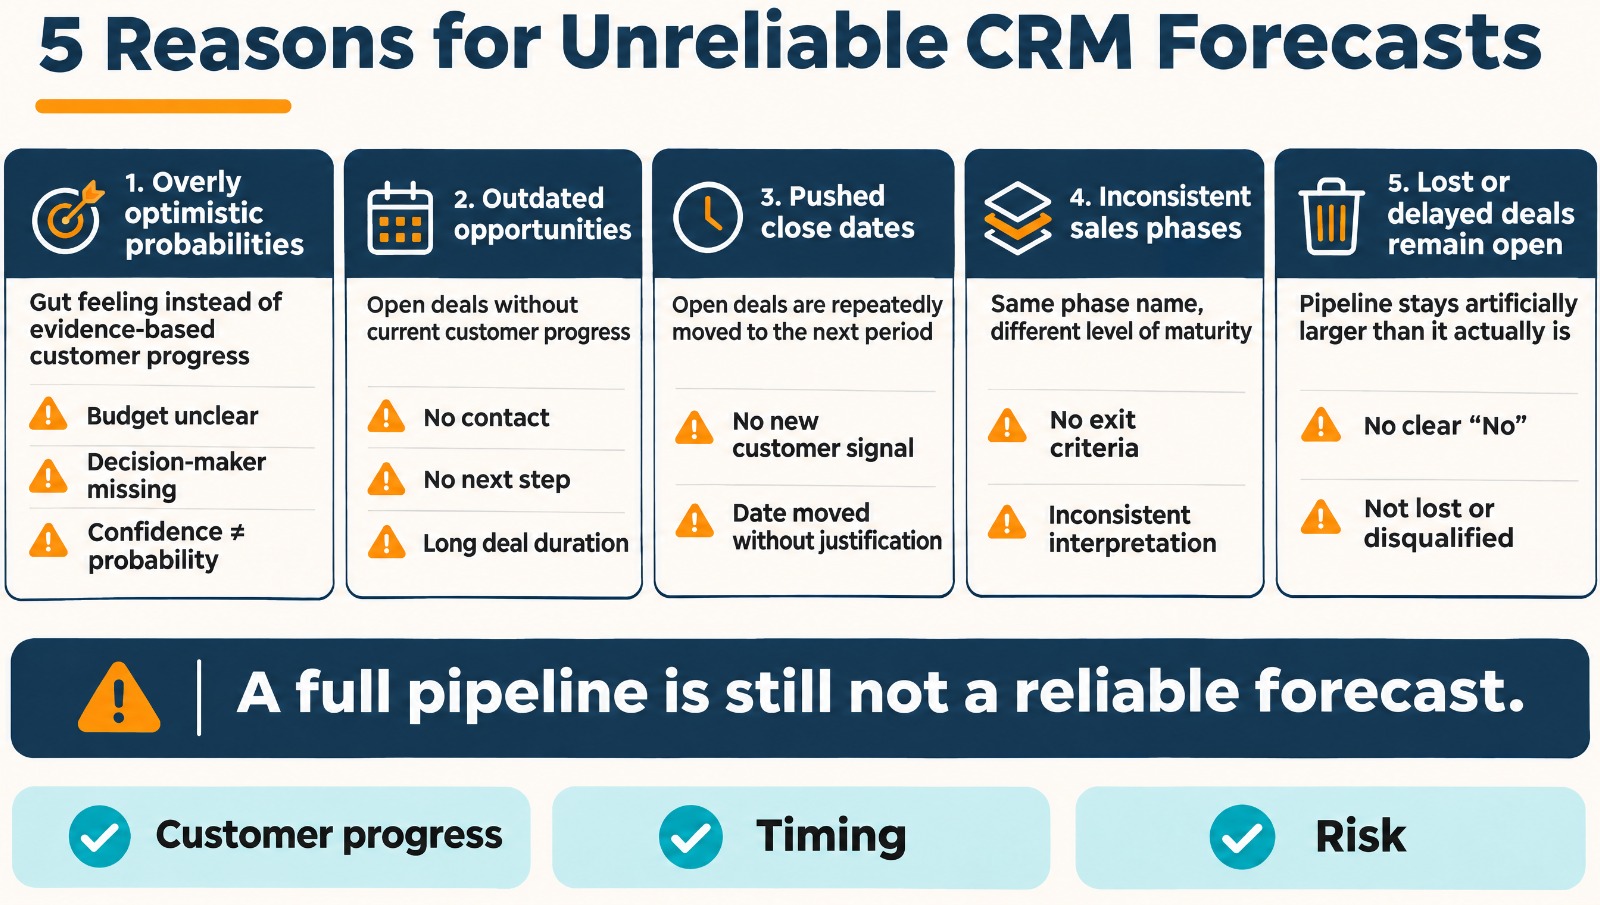
Overly optimistic probabilities
“The customer is thrilled” describes a positive reaction. Whether budget, decision-making authority and a binding procurement plan exist remains open. If probabilities mainly express the confidence of the sales reps, the forecast becomes dependent on individuals. Regularly check how often comparable opportunities from a given stage were actually won.
Stale opportunities
An opportunity has been sitting unchanged in the CRM for months but is still being counted. Without current customer contact, confirmed need or an agreed next step, it loses its predictive value. This requires review rules per sales stage and deal type. A complex investment project may take longer than a standardized reorder.
Close dates that keep being pushed
At the end of the month, open opportunities are moved en bloc into the next month. The pipeline still looks good, even though nothing has changed on the customer side. A new close date should therefore be justified by a new event, such as a confirmed purchasing meeting or an updated decision plan.
Inconsistent sales stages
For one rep, negotiation begins when the quote is sent. For another, only when price, scope and contract terms are discussed in concrete terms. A shared stage name then conceals different levels of maturity. Reports can only make these differences visible if the criteria have been standardized beforehand.
Lost or postponed deals stay open
Some opportunities never disappear from the pipeline because marking them “lost” feels more uncomfortable than postponing them once again. Postponed decisions also often remain under an optimistic close date. A properly documented no or “no decision at this time” improves planning. Leadership has to make this honesty possible instead of treating a cleaned-up pipeline as poor performance.
How accurate does a forecast really need to be?
A universal target accuracy is of little help. A company with many regular orders has different conditions than a provider with a few large project deals. The forecast horizon also changes how meaningful it is: three weeks before the end of the quarter, more can be substantiated than six months earlier.
You should therefore define fixed measurement points. Compare, for example, the forecast eight weeks before the end of the quarter with the actual order intake for the quarter. A forecast updated later must not replace the original figure in this evaluation.
A metric that is easy to understand is the absolute deviation: forecast minus actual as an absolute amount, divided by the actual. With a forecast of 1.2 million euros and actual order intake of one million euros, it is 20 percent. If the actual is zero, this relative metric is not defined; the deviation must then be shown in euros.
The direction of the deviation is also needed. A team that regularly forecasts too high has a different problem than one that consistently estimates too low. And even a forecast that is accurate overall can hide weaknesses if unexpected deals happen to offset the loss of others.
What matters is whether risks become visible early enough to still act on them. An honest gap eight weeks before the end of the quarter is more valuable to management than a reassuring figure that only collapses on the last day.
Clear sales stages instead of gut feeling
Sales stages should reflect the customer’s demonstrated progress in the buying process. “Quote sent” initially documents an activity of the sales team. “Quote discussed with the decision-making committee, open points and decision date confirmed” provides much more substance.
Each stage needs traceable entry and exit criteria. In a qualified opportunity, for example, need, contacts and the next joint step could be clarified. For a late negotiation stage, the budget path, decision process and key contract issues would also have to be known. Which criteria make sense depends on the business model.
This needs to be distinguished from the forecast category. An opportunity that is well advanced can still drop out of the current quarter if purchasing only decides in the next quarter.
A practical model distinguishes between pipeline, commit and additional potential. The commit contains the deals for the period that are reliably expected according to defined criteria. The best case adds further specifically named opportunities to the commit, provided favorable conditions occur. This view must clearly state whether values are cumulative, so that nobody accidentally adds commit and best case twice. A commit remains a well-founded assessment. It is not a guarantee and should not be demanded as one.
The metrics management needs
A good management dashboard answers a few questions reliably. How large is the remaining gap? Which deals carry the forecast? Where is the situation getting worse? The metrics must use the same time periods, value measures and filters.
Pipeline coverage: The qualified open pipeline volume for the period is divided by the remaining sales target. High coverage only helps if the opportunities can be decided within the period. There is no universally correct factor.
Win rate: Won opportunities divided by all won and lost opportunities in a defined evaluation. A rate by count can show a different picture for large projects than a rate by value. Both perspectives should be separated by segment and deal type where needed.
Slippage: What share of the deal volume expected at a fixed cut-off date is pushed into later periods? A saved baseline prevents postponed opportunities from disappearing from view. Lost and reduced deals should remain visible separately.
Deal age and stage duration: How long has an opportunity been open, and how long has it been in its current stage? Comparing it with similar deals shows where a review is needed. A high age alone does not prove a loss.
Conversion per stage: How many opportunities in a defined group reach the next stage or a successful close? This requires the stage history. The current distribution of the pipeline is not yet a conversion analysis.
Commit, best case and change since the last snapshot: Management should be able to see which deals have been added, dropped, postponed or changed in value. In addition, the deviation between an earlier forecast and the actual shows whether the assessments are becoming more reliable over time.
With a few large opportunities, concentration also needs to be examined: how much of the forecast depends on the three largest deals? For staffing and capacity decisions, this information is often more important than another decimal place.
Forecasting is a leadership process
A forecast does not get better because management asks for a number more often. It gets better when the quality of the underlying assessments improves. A regular pipeline review should therefore focus on the changes since the last snapshot. Has the customer confirmed a meeting? Is the decision-maker still involved? Which prerequisite for closing is missing? And what concrete support can sales management provide?
It pays to keep target and forecast strictly apart. The target describes what should be achieved. The forecast describes what can be expected based on current knowledge. Treating both as the same encourages numbers that are meant to meet expectations.
Responsibilities remain clearly divided: opportunity owners maintain facts and next steps, sales management reviews the assessments, and finance translates expected deals into revenue and liquidity effects. Management decides which measures follow from the scenarios.
Ten concrete improvements in the CRM
The CRM should support this process with as little additional maintenance effort as possible. What helps is a small amount of reliable information, a traceable history and clear exceptions. New mandatory fields are worthwhile where their content actually improves a decision.
| No. | Proposal | Description |
|---|---|---|
| 1 | Define the forecast measure | Clearly name order intake, contract value or annual recurring value and distinguish them from one another. |
| 2 | Document stage criteria | Store verifiable prerequisites and exit criteria for each sales stage. |
| 3 | Record the next customer step | Document a concrete agreement with date and owner. |
| 4 | Log close date changes | Keep the previous date, new date and reason for the change traceable. |
| 5 | Review stale opportunities | Create review lists by stage duration, deal type and lack of customer progress. |
| 6 | Justify the commit | Record customer confirmation, decision path and remaining risks for expected deals. |
| 7 | Save forecast snapshots | Store weekly snapshots in order to analyze later changes and forecast errors. |
| 8 | Focus the management dashboard | Show target, actual, commit, additional potential, gap and key individual risks together. |
| 9 | Align with finance and ERP | Match won opportunities with actual orders and enable the reconciliation to revenue and cash receipts. |
| 10 | Define responsibilities and rights | Specify who assesses opportunities, approves forecasts and may change earlier snapshots. |
In SugarAI, for example, the forecast module can be configured by periods, inclusion ranges and scenarios. Which additional reports, validation logic or histories are needed should be derived from the management questions. Functional scope and implementation depend on the edition, version and configuration. Source: SugarAI Support, Forecast Configuration, Version 25.2.
These business rules can also be applied to an implementation with SpiceCRM or SuiteCRM. What matters is which requirements the existing installation already covers and where configuration, extensions or integrations are needed.
Where AI helps with forecasting
AI can provide additional indications if suitable data and the corresponding functions or integrations are available. A model could, for example, detect unusually long stages, analyze changes in the communication history or take into account historical patterns of similar deals. A risk indication is particularly useful when its basis is visible, for example repeatedly postponed meetings combined with a lack of customer responses. Some tasks do not need AI at all. A missing next step or a close date that expired weeks ago can be detected with a simple rule. Such checks should work reliably first.
With an AI-supported forecast, it must then be checked whether it actually improves on the previous method. Comparisons on later periods that were not yet known when the model was developed are suitable for this. Especially with a few large projects or strongly changed market conditions, the significance of historical patterns remains limited.
AI improves a well-run forecast process if its indications are traceable and prove themselves in comparison. Responsibility for commit, priorities and company planning remains with the managers in charge.
Practical example: from wishful pipeline to reliable planning
The following example is an illustrative scenario with assumed figures. It does not describe a documented MyCRM customer reference or a performance promise.
A B2B project service provider with twelve sales employees plans its project teams based on the CRM pipeline. Eight weeks before the end of the quarter, enough opportunities regularly appear in the forecast. In reality, several large projects slip while capacity has already been reserved.
The company introduces the new forecast process step by step in its existing CRM solution. In the first phase, sales and finance agree on order intake as the forecast measure. They standardize the sales stages and clean up the open opportunities. The visibly smaller pipeline makes clear for the first time how large the actual planning gap is.
In the second phase, one sales team tests a weekly review with clear commit criteria for four weeks. Feedback from the pilot feeds into the next adjustment: unnecessary mandatory fields are dropped, and the justification for close date changes is made more precise. This is followed by the rollout to the entire team.
Only in the third phase are saved forecast snapshots, a management dashboard and automatic review lists added. The illustrative starting values are 30 percent absolute forecast deviation and 35 percent slippage by deal value. In two later quarters, the assumed values are 12 and 18 percent respectively. In each case, the snapshot saved eight weeks before the end of the quarter is compared with the result for the same period.
In the example, the deviation thus falls by 18 percentage points and slippage by 17 percentage points. Two quarters are not yet enough to prove a lasting effect. They do, however, set a verifiable direction and show whether further adjustments make sense.
For management, the benefit arises even earlier: it recognizes critical capacity decisions in good time and can tie hires or external resources to concrete scenarios. The win rate does not even have to rise for this at first. A more realistic assessment of existing business alone improves predictability.
Checklist: Does your CRM forecast support company planning?
Whether your forecast is reliable shows in its foundations: it starts with a traceable definition of the figures, then requires consistent rules for assessing individual opportunities, and saved snapshots show whether these rules work in practice. Management, sales leadership and CRM owners can use the following checklist to review the most important gaps together.
- We distinguish between order intake, revenue and cash receipts.
- Sales target and forecast are reported separately.
- Every sales stage has traceable entry and exit criteria.
- Close date and next customer step are factually justified.
- Stale, postponed and lost opportunities are consistently reviewed.
- Commit and best case are clearly defined and not counted twice.
- Large individual risks remain visible alongside the totals.
- Earlier forecast snapshots are saved at fixed cut-off dates.
- We measure deviation and slippage using consistent definitions.
- Regular reviews lead to concrete measures with owners.
- Finance can translate expected deals into revenue and liquidity scenarios.
- AI indications are traced and checked for their added value.
Conclusion: A forecast has to support decisions
A reliable forecast is built on clear definitions, demonstrable customer progress and a leadership culture that makes risks visible early. The CRM keeps this information together and makes changes traceable.
The first step is manageable: take the last saved forecast and check which deals actually came in. Then examine the largest deviations. This usually leads to more concrete improvements than the wish for yet another dashboard.
Can your management actually make decisions based on the CRM forecast? If the answer remains unclear, it is worth taking a joint look at sales stages, data quality and the review process. MyCRM helps you clarify these foundations and implement them step by step in your CRM solution.